
See your crops in a whole new light.
Drone mapping for early stress detection, better scouting, and data-driven decisions.
Maximize efficiency in orchard and field management.


We use multispectral drones to spot plant stress before it’s visible to the naked eye, letting you take action before problems become apparent or incur higher costs.
Biweekly or monthly scans of your crop can track seasonal trends or reveal sudden drop off in plant health, helping identify problems with pests, irrigation, or soil quality.
Turn imagery into action.
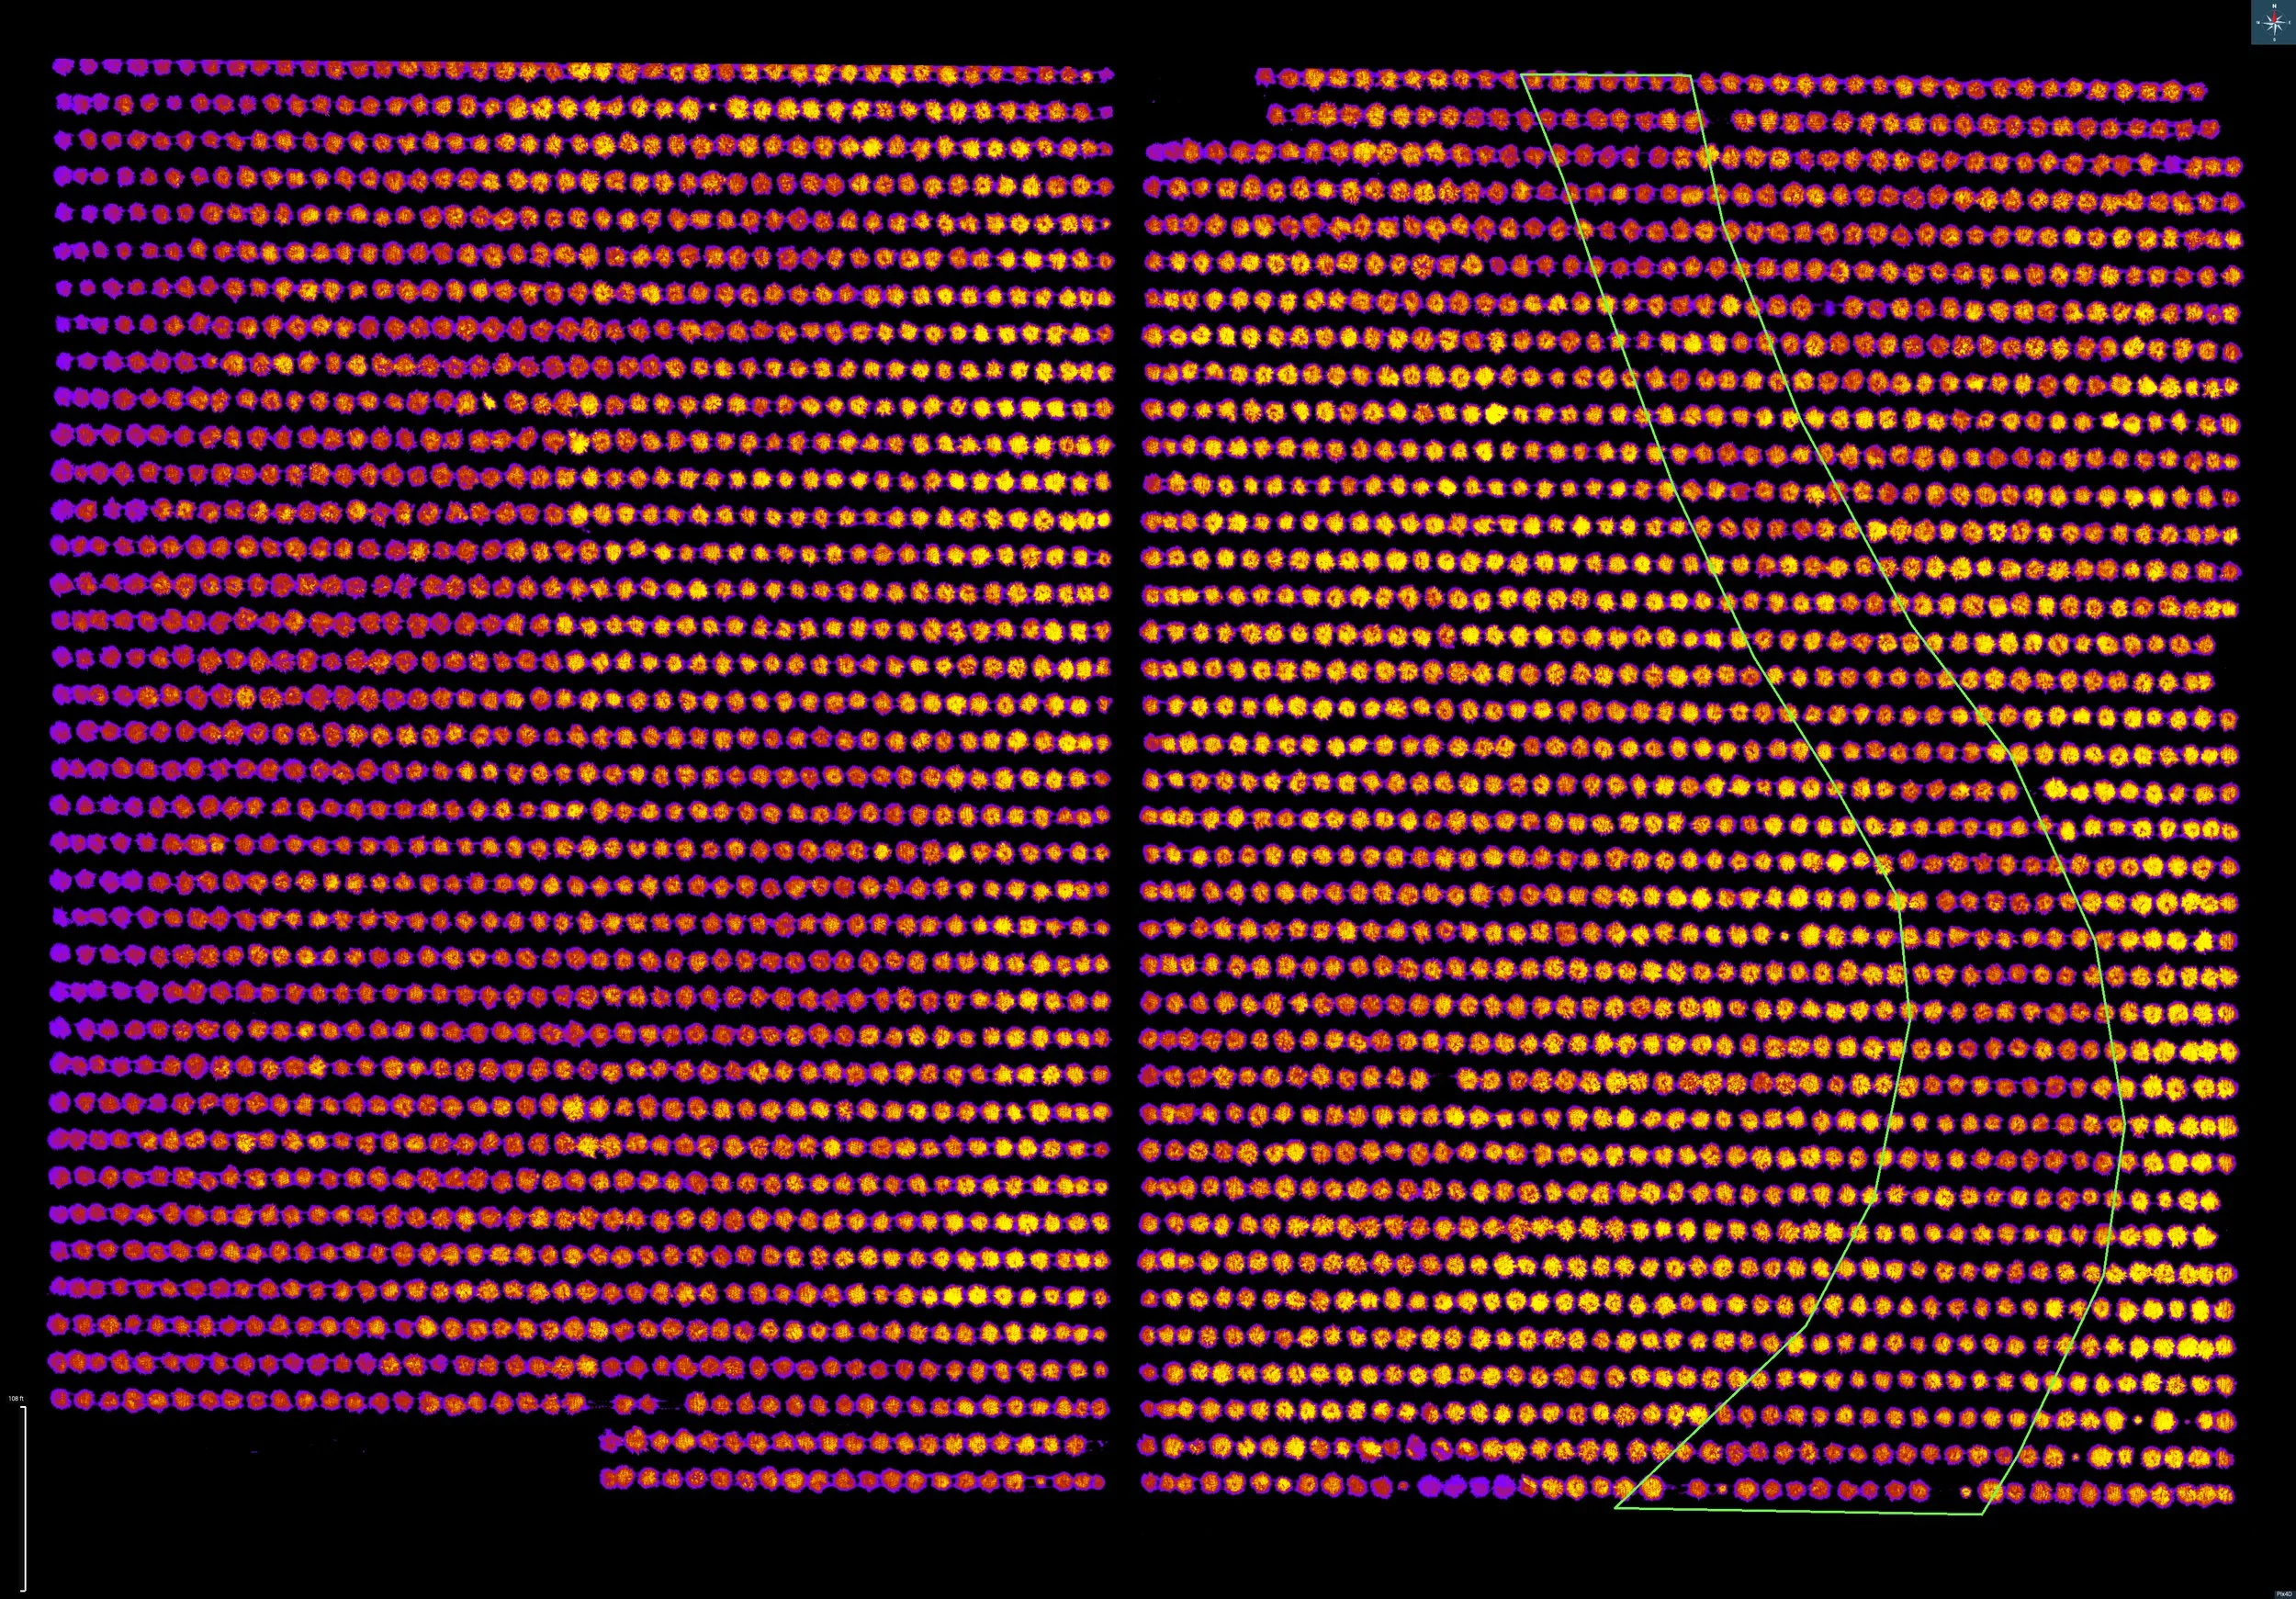
A streak of sandy soil was identified by the grower using our NDVI stress maps.
-
Spend more time scouting areas that need it most, and are most susceptible to pest pressure.
Identify macro trends by gaining a new perspective of your field or orchard.
Closely monitor individual trees or rows.
-
Compare periodic flights to assess changes throughout the growing season, revealing emerging pest pressure or documenting improvements.
Create charts or graphs comparing NDVI levels to visualize growth over weeks, months, or seasons.
-
Reference past records to determine effectiveness of pest control efforts.
Share visual records with your key partners like PCAs, work crews, or insurance agencies.
-
Save resources with variable rate applications- apply nutrients, fungicides, or pesticides only where needed.
Cut input costs with variable rate applications.

Conversion from NDVI map to prescription map for variable rate applications.
Prescription maps help cut chemical and fertilizer costs by targeting treatments only where they’re needed.
We divide your fields into zones based on plant health. Each tile in the grid gets a customized application rate — saving money on fertilizers, fungicides, and pesticides.
Import prescription maps into spray drones or ground equipment for precise delivery, or print out as a field guide for applicators and PCA’s.
-
Prescription maps show exactly where plants are nutrient-deficient.
Growers can apply more fertilizer only where it’s needed, and reduce or skip application where the field is healthy.
Prevent lodging by applying less fertilizer to healthy areas.
-
Identify stressed or disease-prone zones.
Spray only affected areas instead of blanketing the entire field.
Helps slow pesticide resistance and protects beneficial insects.
-
Plant more seeds in high-productivity areas and fewer seeds in poor soils.
Maximizes yield potential and reduces wasted seed costs.
What is NDVI?
Normalized Difference Vegetation Index (NDVI) is used to quantify vegetation greenness and is useful in assessing changes in plant health. It has a high correlation with the true state of vegetation on the ground.

The index is easy to interpret:
NDVI will be a value between -1 and 1. An area with nothing growing in it will have an NDVI of zero. NDVI will increase in proportion to vegetation growth. An area with dense, healthy vegetation will have an NDVI of one. NDVI values less than 0 suggest a lack of dry land. An ocean will yield an NDVI of -1
Get started with field mapping
-
STEP 1
Get a free quote
After a quick consultation, the property is scouted for obstacles and boundaries. Flight missions are prepared and billable acreage is estimated.
-
STEP 2
Flight Mission
An FAA certified commercial drone pilot arrives on site to scan your field or orchard periodically, based on the agreed-upon acreage and schedule.
-
STEP 3
Delivery of Report
High resolution stress maps and an NDVI data spreadsheet are delivered to the client within 72 hours of flight. Complimentary prescription maps are available upon request.
Deliverables


High resolution NDVI stress maps, showing vegetation health using a heatmap-style overlay.
Shareable data spreadsheets that are updated after each flight, listing NDVI levels, annotations, and flight details.
Custom prescription maps.